Does deep learning and coding deter you from using it? As ecologists, we experienced that too, but we have dived in. In our new paper, led by Rebecca James, we employed deep learning to automate the analysis of aerial drone imagery to assess spatial patterns within subtidal #seagrass meadows and the distribution of turtles UNDERWATER 🌊🐢.
Now you can try deep learning on your own system because we provide accessible, open-access tools to automatically classify vegetation and animals in aerial imagery.
🌿🚁 Paper highlights:
* Deep learning efficiently detected subtidal seagrass patterns and sea turtle distribution at large scales.
* By comparing over space and time, we were able to identify changes in the spatial patterning of seagrass patterns and used this to infer the resilience of the meadow.
* Comparing 2012 vs. 2022 data demonstrates the adaptability of deep learning models for retraining with new aerial imagery.
* Lower ecosystem resilience was observed at meadow edges, with resilience declining over a decade.
* These new tools provide a quantitative method for monitoring ecosystems and inferring resilience. And stimulate the uptake of deep learning for ecological applications.
Read the paper here: https://doi.org/10.1016/j.ecoinf.2024.102580“Monitoring vegetation patterns and their drivers to infer resilience: Automated detection of vegetation and megaherbivores from drone imagery using deep learning”
The deep learning and post-processing scripts can be found here
https://git.wur.nl/deep-learning-tools615for-marine-ecosystem-monitoring
📝 Authors: Lead and scientific millipede; Rebecca James, Machine learning champions; hashtag#Freek Daniels, Aneesh Chauhan, Remote sensing experts; Pramaditya Wicaksono, Muhammad Hafizt, and Setiawan Djody Harahap; and myself thanks to hashtag#NWO-WOTRO for the funding
hashtag#DroneMagic hashtag#DeepLearningDiscoveries hashtag#TeamScience hashtag#NewPublication 🌱🔍🚀
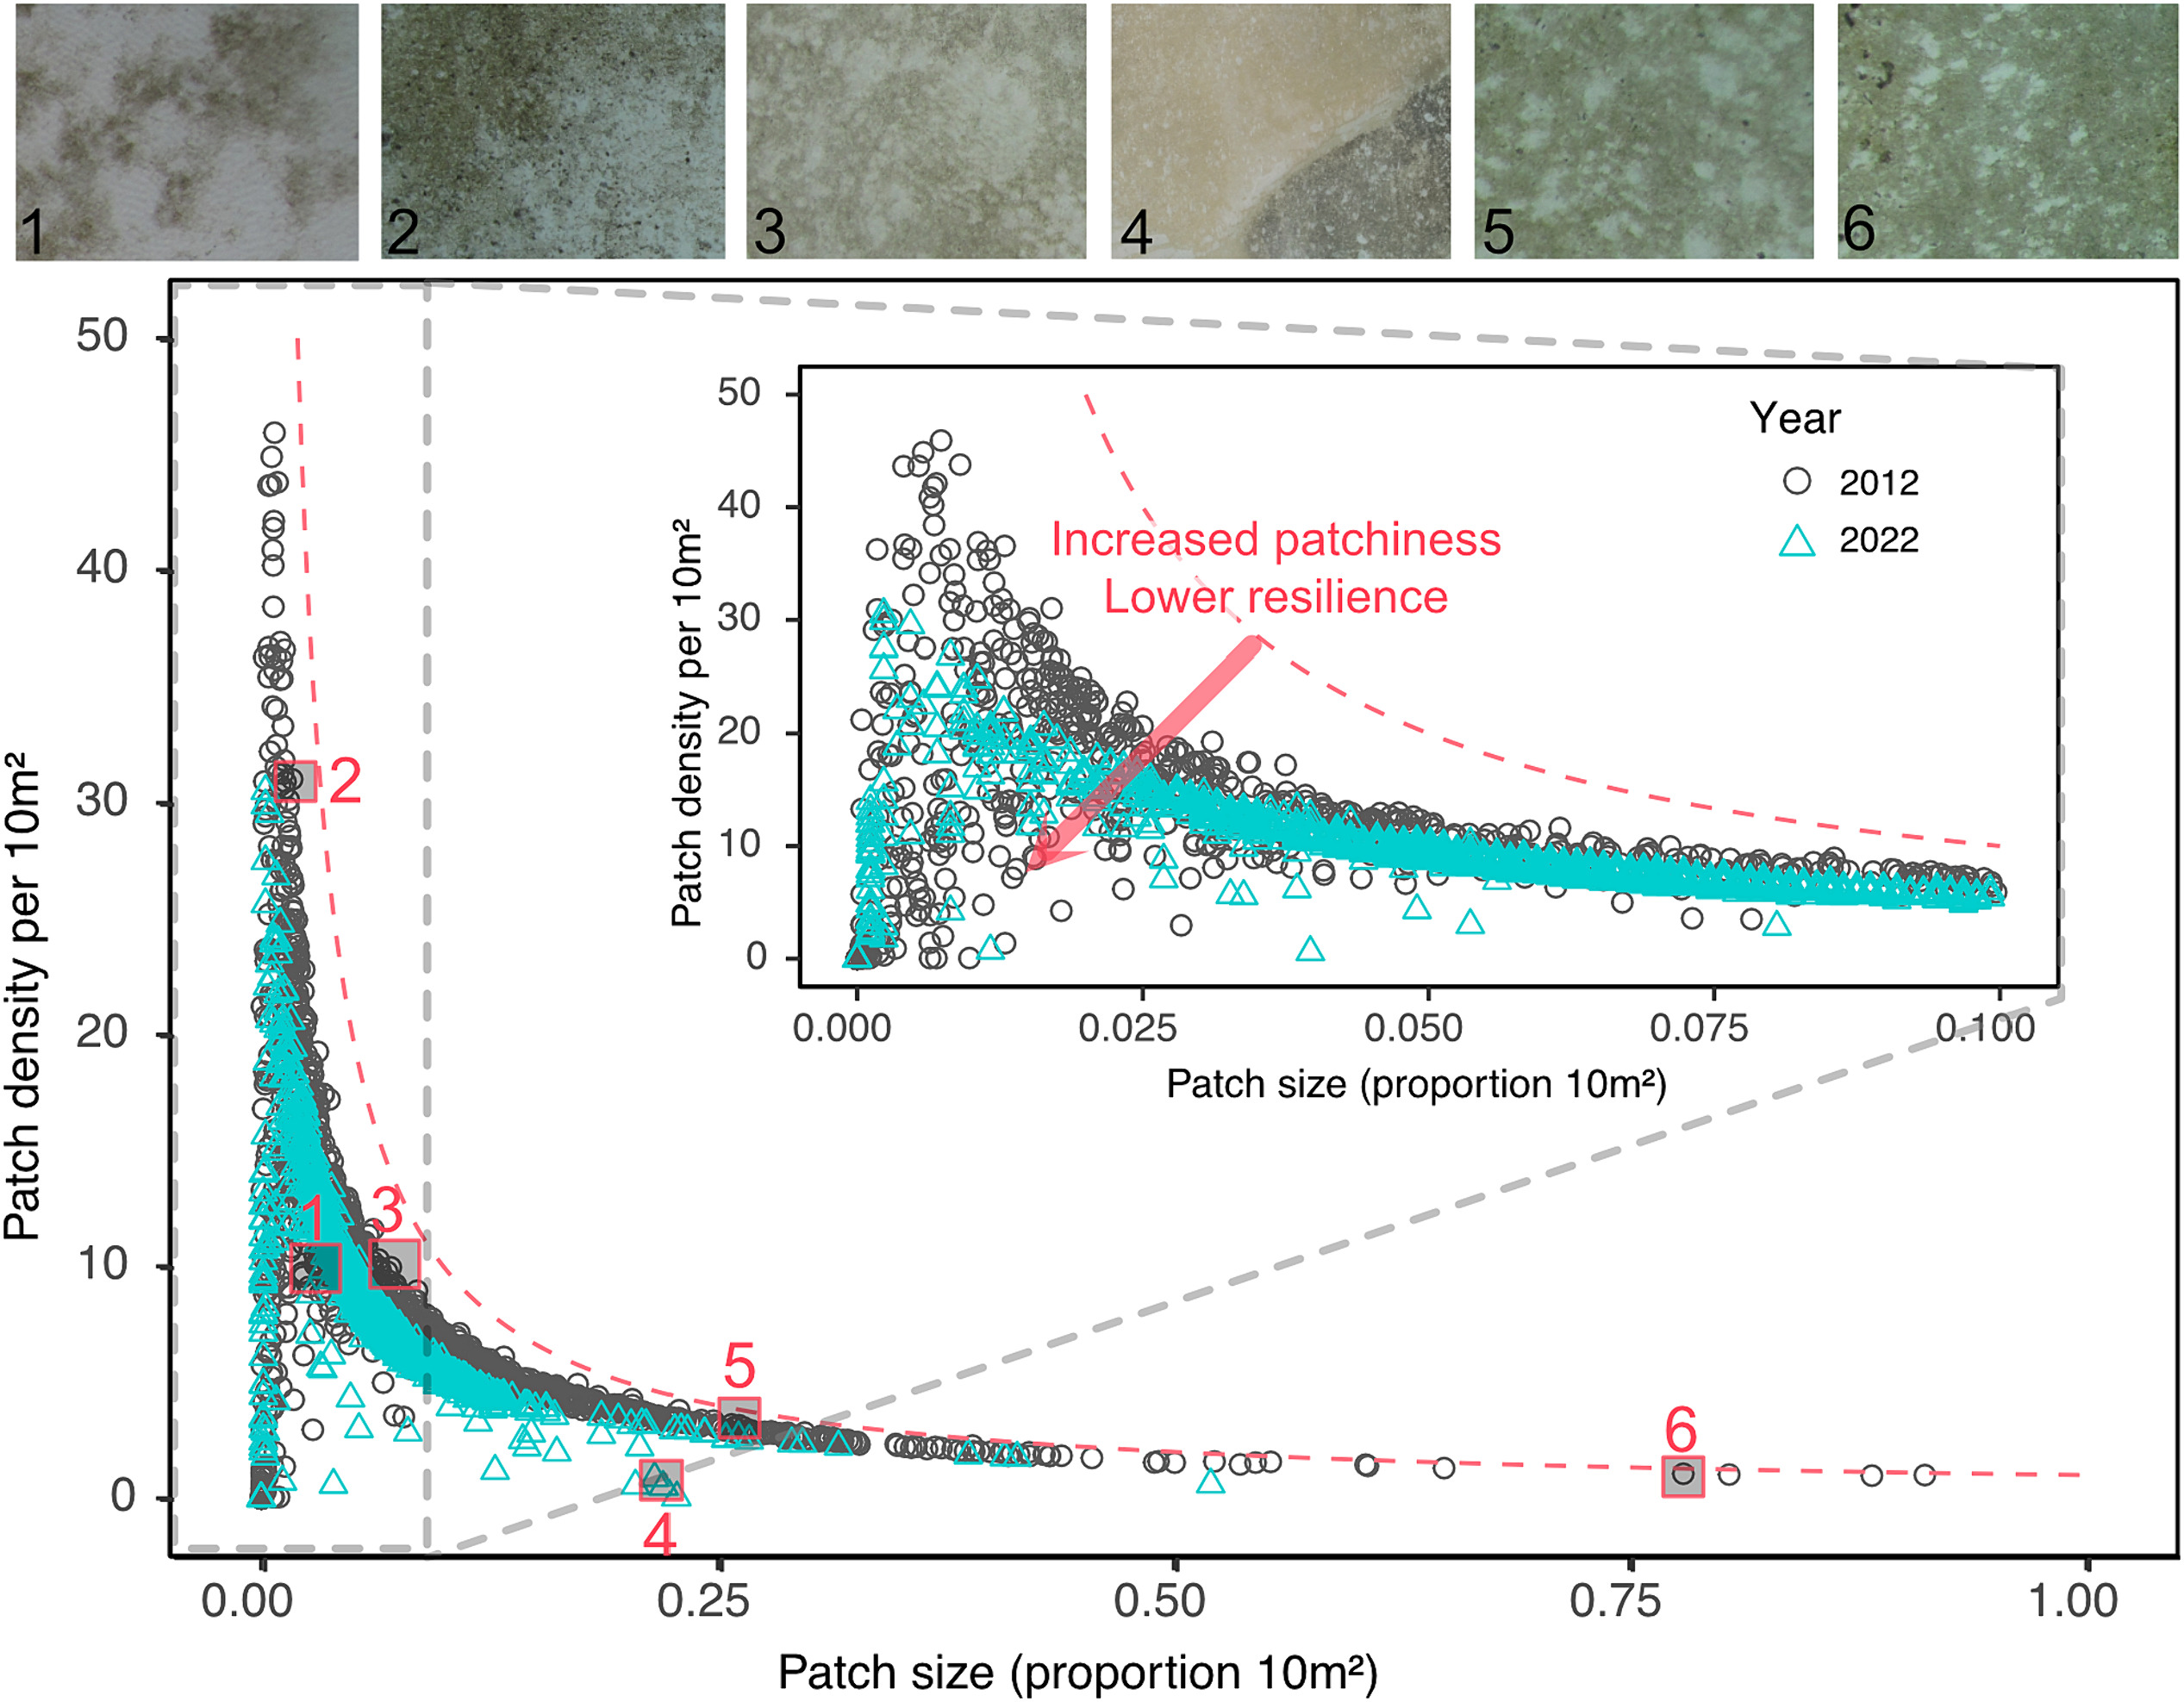
plotted against the vegetation patch size for each subset image (representing an area of 12 x 16 m) in the 2012 (black circles) and 2022 (green triangles) aerial imagery. The physical upper limit of the patch density versus patch size is depicted with the dashed red line. Patchiness increases with a decline in patch size and density, with the distance of the points from the physical limit providing an indicator of the resilience i.e. the further the distance, the lower the resilience. Numbered images of vegetation patchiness above display the region that the corresponding numbered point represents. Graph inset displays all of the points with a patch size proportion between 0 and 0.1 of 10 m2.